There are many different technologies available for identifying failure indicators before they snowball into costly repairs and worse, causing a shutdown of production. However, if not performed correctly, the value of these technologies is significantly diminished. Let’s take a closer look at the “big players” in early detection and the pitfalls of not using them correctly.
Vibration Analysis
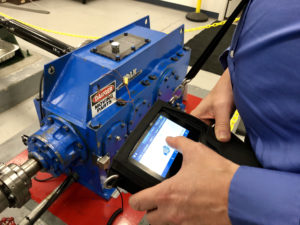
Most failure modes can cause an increase in vibration. That’s why this area of machine health is the predominant and most widely used method to determine equipment condition and predict failures.
“No single measurement can provide as much information about a machine as the vibration signature.” – Art Crawford, founder of IRD Mechanalysis
Common faults detected with vibration analysis:

- Misalignment
- Looseness
- Unbalance
- Bent shaft
- Bearing failure
- Gearbox failure
- Pump cavitation
- Electrical faults in motors
- Resonance and natural frequencies
Pitfalls of incorrect application
As powerful a tool as vibration analysis is for early fault detection, it is often the most misapplied technology of all the condition monitoring tools. Here are a few examples:
- Improper accelerometer mounting
Mounting an accelerometer correctly is key to obtaining reliable data. Too often, when placing the accelerometer, technicians allow the device’s magnet to pull the accelerometer out of their hand and slam it down onto the machine. Doing so does two things: it disturbs the settling time needed by the accelerometer before accurate data can be taken and it can be damaging to the accelerometer itself. The proper way to mount an accelerometer is to bring it close to the machine at a side angle so the magnet doesn’t pull the device from your hand and gently tip it onto the machine.
- Improper monitoring techniques for specific machine types
Many times, we find customers who have a Vibration Analysis Program that are routinely collecting data on equipment, but have databases setup too generically. Database setups define the vibration test data results captured while taking route-based samples and need to be specifically tailored for each machine type being monitored. All too often only speed is used to differentiate measurement types from machine to machine, leading to improper Frequency Ranges and Lines of Resolutions being collected for analysis. This leads to many missed diagnoses, increases in time for taking additional “off-route” data, and limits the ability for early fault detection.
- Using vibration analysis more reactively than proactively
All too often, companies lose sight of the value of vibration analysis as a tool of PdM and use it as more of a reactive maintenance tool. For example, simply using vibration analysis data to find a bearing defect in a machine and then scheduling it for repairs without utilizing that information in a Root Cause Failure Analysis. One could argue that the technology “predicted” a potential catastrophic failure, but without the Root Cause Failure Analysis, you are still simply “reacting” to a failed bearing. The PdM data needs to be used to its fullest in order to obtain maximum cost reductions and payback to the facility by actually providing answers to why equipment fails in the first place. The information then can be used by the reliability program to implement changes that will actually “prevent” future failures of this type from occurring.
Oil Analysis
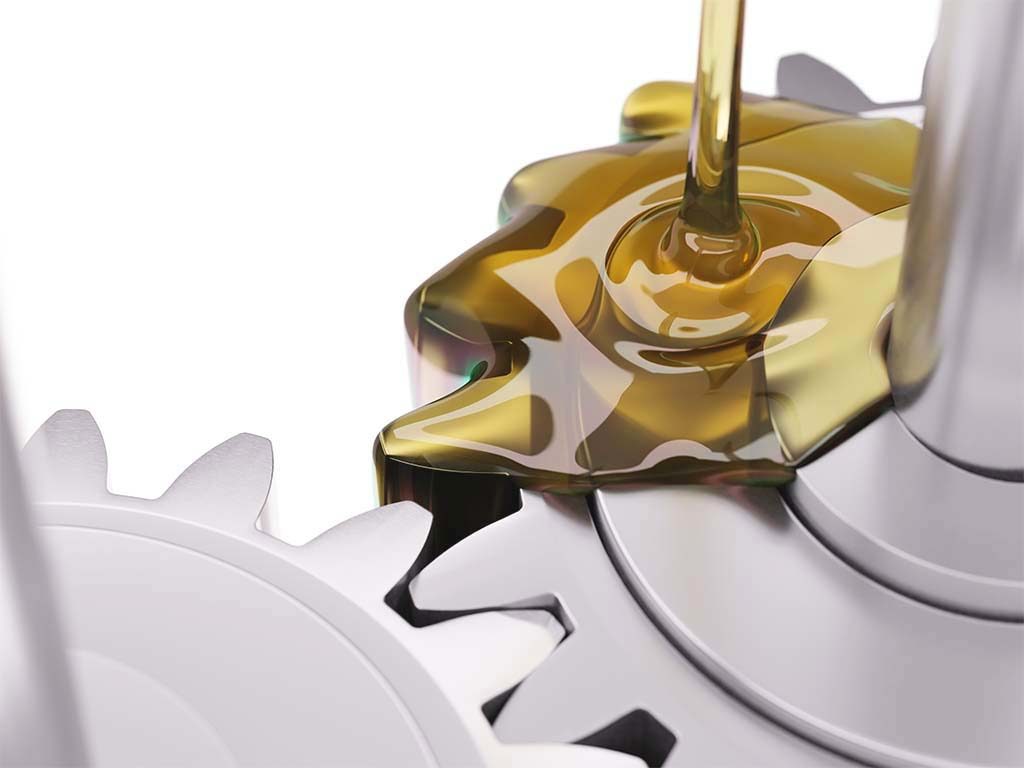
Oil analysis is the sampling and laboratory analysis of a lubricant’s properties, suspended contaminants, and wear debris. (Vibration institute) Since oil and other lubricant types can be considered the “Life Blood” of our equipment, it only makes sense that PdM and CBM tests can yield information regarding impending failures. Oil Analysis data contains information not only on the state of the lubricant being sampled but also the condition of the equipment that it was pulled.
Common faults detected with oil analysis:

Lubrication Faults
Viscosity problems
Water incursion
Additive pack depletion
Other chemical properties (acid Levels, etc.)
Oil mixes of different types of lubricants
Machine Faults
Gear wear
Bearing failure
Seal failures
Filtration issues
Pitfalls of incorrect application
- Testing only when a problem occurs
Much like vibration analysis, oil analysis is a bit of a trending game. Using oil analysis only when a problem occurs and therefore, not establishing any historical data during “normal” operating times, the diagnosis of issues is highly unreliable and shifts its use from a “predictive” tool to a “reactive” function. - Testing too infrequently
Part of establishing historical data is performing oil analysis at regular and frequent intervals. While companies sometimes cut back on the frequency of oil analysis as a cost saving measure, they often find it a short-sighted solution with long term ramifications. - Utilizing poor sampling techniques
Extracting oil samples is often the weakest link in the oil analysis process as certain methods are more likely to result in contamination. For example, sampling from the drain port using a drop-tube and vacuum pump are probably the most commonly used techniques for extracting oil samples. Unfortunately, they are also the two techniques most likely to produce contaminated samples. Dedicated sample valves installed in correct locations, along with consistently documented sampling procedures is the more reliable way to go. For circulating lubrication systems, sampling should be obtained ahead of any filters.
Infrared Thermography (electrical or mechanical)
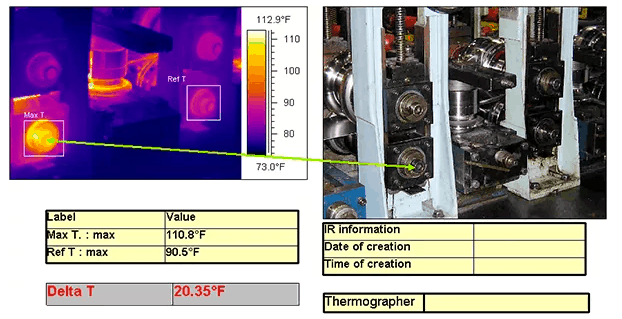
Nearly everything that uses or transmits power gets hot before it fails. Infrared Thermography is the ONLY diagnostic technology that enables instant visualization and verification of thermal performance when used by a qualified technician.

Common faults detected with infrared thermography
Electrical
Loose connections
High resistance connections
Damaged contacts
Overloaded circuits
Mechanical
Faulty heat exchangers
Plugged filters
Coupling defects
Bearing defects
Pitfalls of incorrect application
- Not scanning under load
If a machine is without load it won’t generate heat and as a result, faults will not be visible. This is valid for both mechanical and electrical surveys. - Misreading reflections
A common mistake when using infrared thermography is to identify a “fault” that is actually a reflection. For example, if you’re standing in front of a metal surface conducting an infrared scan, chances are that the “hotspots” you see are really just reflections of heat from your own body, another heat source. - No direct line of sight/field of view
IR cameras are not X-ray cameras…they can’t see through things. They only detect heat from the object you are looking at so if you do not have a direct line of sight, faults could be missed.
Electric Motor Testing (online and offline)

Photo provided by PdMA Corporation
Motors are literally the driving force behind many industrial processes. So, when they fail, it can cause production shutdown and millions in lost revenue. That’s why by both online and offline testing to be considered when developing a reliability centered maintenance program.
Common faults detected with online motor testing
Online testing, also known as dynamic testing, is performed while a motor is running and provides data on the power quality and operating condition of a motor. Faults detected include:
- High/low voltage levels
- Voltage and amperage imbalances
- Rotor bar and air gap defects
- Bearing defects
Common faults detected with offline (static) motor testing
Offline testing, also known as static testing, is performed while the motor is not running and provides data on the electrical circuit and in some instances the rotor’s reactance to the windings. Faults detected include:
- High resistance connections
- Imbalances between the windings
Pitfalls of incorrect application
- Improper training
Though most online and offline test equipment comes with preset test regiments and Alert/Alarm settings, it is key for the person performing the tests to know the test tools, equipment being tested, and basic electrical theory in order to effectively diagnose the results. All too often these tools are introduced to PdM departments with only the OEM’s basic training provided to a handful of technicians who have little to no electrical background. - Improper periodicities
Motor testing, like any PdM technology, should be setup to provide meaningful data on equipment prior to a catastrophic failure occurring. A dedicated test schedule should be built up front in order to aggressively find problems prior to failures, and guide the scheduling of necessary repairs. Program metrics will then need to be used to monitor the amount of equipment being tested vs. the amount of findings being made to ensure money and resources are not wasted on unneeded testing.
Ultrasonic Leak Testing
Ultrasonic leak testing is often one of the most overlooked types of CBM applications. Compressed air, gasses, and vacuum systems are often some of the most expensive systems for a plant to operate due inefficacies created by leaks. Ultrasonic Leak Testing is one of the cheaper technologies that can be deployed at a facility, with the largest “instantaneous” payback with tangible results. Additionally, most PdM Technicians can be trained using these tools in less than one day.
Below is an example of what recirculated cavitation looks and sounds like via ultrasonic testing:
Common faults detected with ultrasonic leak testing
- Gasket leaks
- Faulty connections
- Damaged pipe/lines/hoses
- Vessel leaks
- Vacuum leaks
Pitfalls of incorrect application
- Well defined routes, periodicities, and tagging methods not defined
Without defined routes and setup periodicities, there really is no “program”. Going out and identifying leaks is by far easier than managing the findings. A well-defined tagging, reporting, and documenting procedure needs to be maintained to ensure program success.
- Cost per CFM on compressed air and gasses not defined
- The whole purpose of isolating and repairing leaks is to save the facility money.
In order to justify equipment costs, manpower, and the cost of repairs, one must know the value associated with each leak found. The costs for “plant air” will be lower than the costs for “instrument air”, and other purchased gasses at a facility will be even higher. Knowing these costs, calculating each finding, and then showing the resulting “savings” accrued by performing the repairs has to be maintained in order to obtain plant “buy-in” for these services.
Up next, part 3 of our Reliability Centered Maintenance Audits White Paper: “Management of Deployment Technologies.”
