Vibration analysis is only as good as the data collected and the actions taken to address any issues detected. After all, even the best analysts in the world won’t be able to give the correct diagnosis and solution to a machine problem if the data they’re basing it on is bad and/or inaccurate.
In our 30+ years of providing both condition based maintenance training and services to companies across the country, we’ve encountered some common mistakes made when taking vibration data.
Here are five common data collection mistakes and how to avoid them:
Incorrect sensor mounting
Incorrect accelerometer mounting is frequently overlooked for the role it can play in generating grossly inaccurate vibration data. Higher frequency sources of vibration can dissipate if they must cross air cavities (e.g. dirt, dust, grime, gaskets, etc.) That’s why it’s important, especially if working in a dirty environment, to first prepare the mounting surface by wiping it with a clean cloth before attaching the sensor. An accelerometer must make good, solid contact with the bearing housing to obtain accurate data and a dirty surface can hinder it.
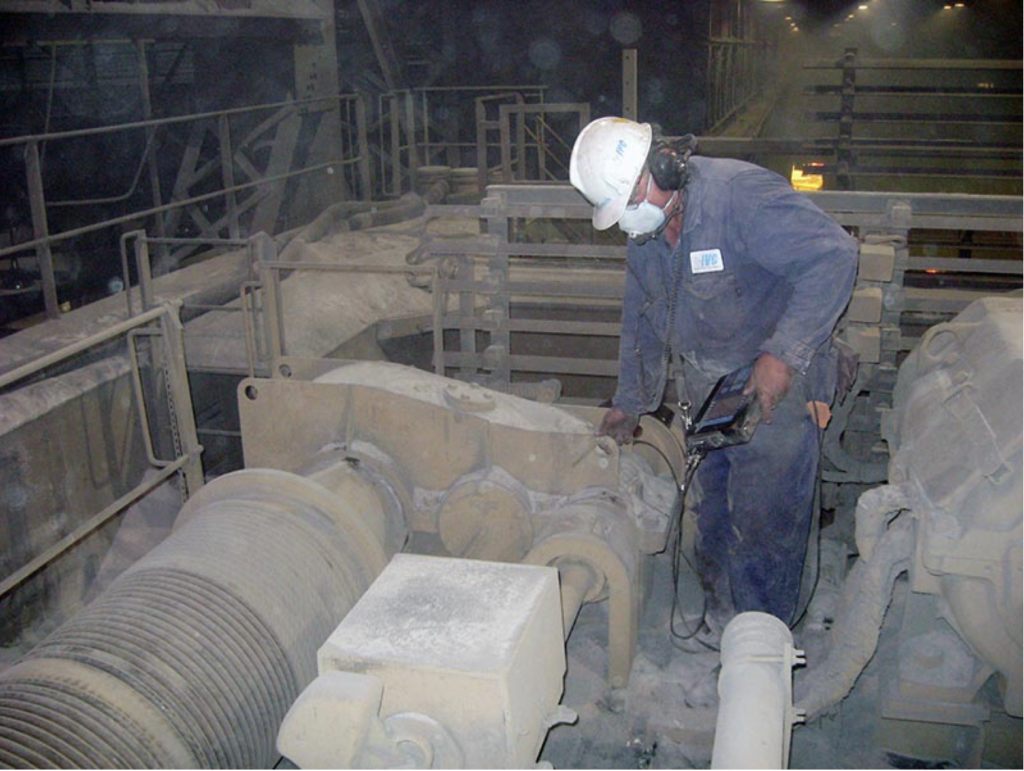
Pictured: IVC analyst taking data on a crane. The dust, known as kish, is ferrous and sticks to the accelerometer magnet.
When it comes to placing the accelerometer, technicians often allow the device’s magnet to pull the accelerometer out of their hand and slam it down onto the machine. Doing so does two things: it increases the settling time needed by the accelerometer before accurate data can be taken and it can be damaging to the accelerometer itself. The proper way to mount an accelerometer is to bring it close to the machine at a side angle so the magnet doesn’t pull the device from the hand and gently tip it onto the machine.
Collecting data from incorrect measurement axes
Machines typically vibrate horizontally, vertically, and axially. Depending on several factors (machine and component orientation, bearing type, nature of the fault condition) the vibration pattern that best indicates the nature of the fault might be present in all axes or it could be in just one. If measurements weren’t taken in that one axis, the fault could be missed. It’s best to have more data to review than a single reading to make a fault determination.
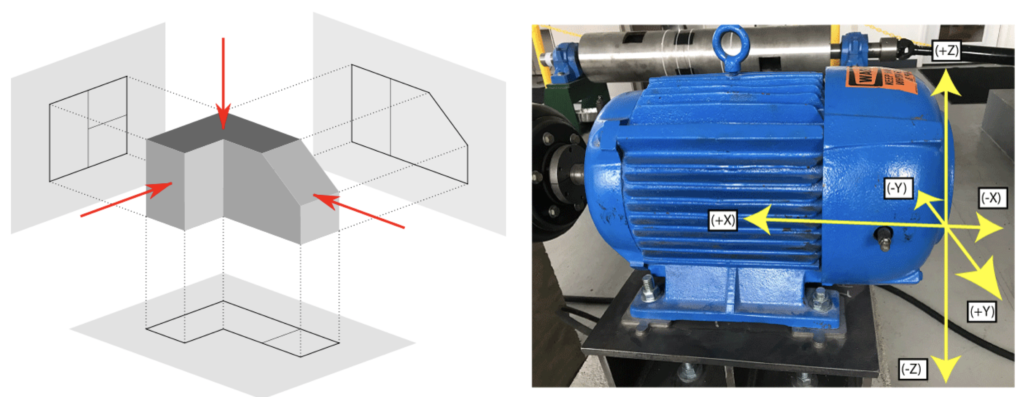
Figure 1: Directionality
Ski slope spectrums
Seeing a ski slope on a Colorado mountainside is a beautiful thing; seeing one on your spectrum? Not so much.
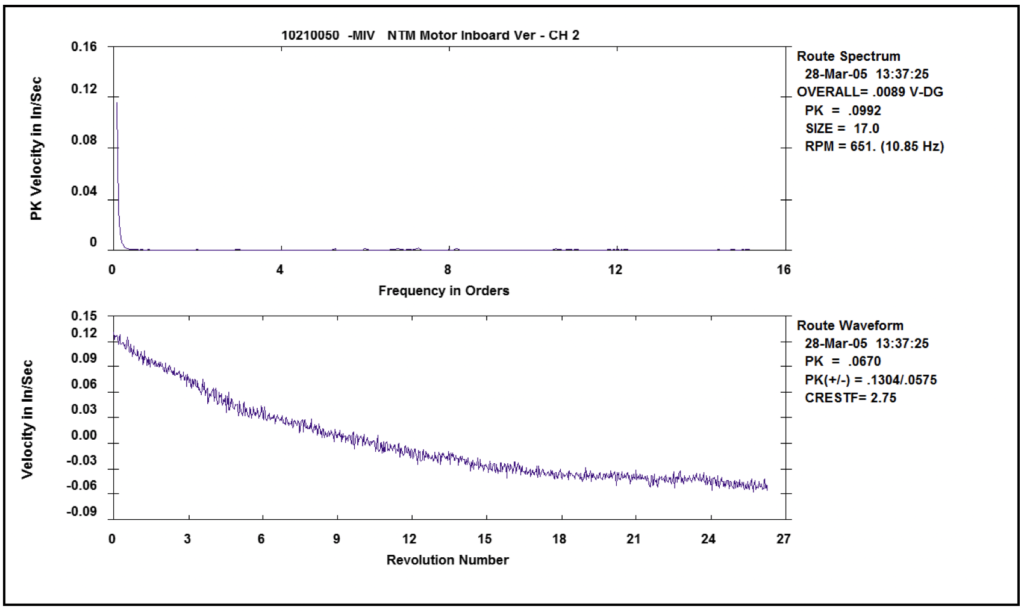
Figure 2: Ski slope spectrum
The presence of a “ski slope” (data viewed in the frequency domain that appears at high amplitudes at very low speeds then ramps down to almost nothing at higher frequencies) is indicative of “bad data” and should be discarded. Too often, analysts try to analyze this data, even scheduling machinery repair based on it. Several things can cause a ski slope spectrum:
- A fault with the sensor or cable
- Bad grounding on the asset point creating an electrical disturbance to the accelerometer
- High-frequency amplitudes well over the rating of the sensor being used
- Lack of settling time before reading is taken
Setting an incorrect Fmax and LOR
It is critical that the FMax and LOR (lines of resolution) are set correctly. If the Fmax is too low, an analyst can easily miss important information. Likewise, if the LOR is insufficient, important detail will be missed as its closely spaced peaks will merge together making it impossible to distinguish between them.
The figures below demonstrate the importance of setting the correct Fmax and LOR. The analyst chose to increase the LOR in the second spectrum, thereby exposing more detail in the data.
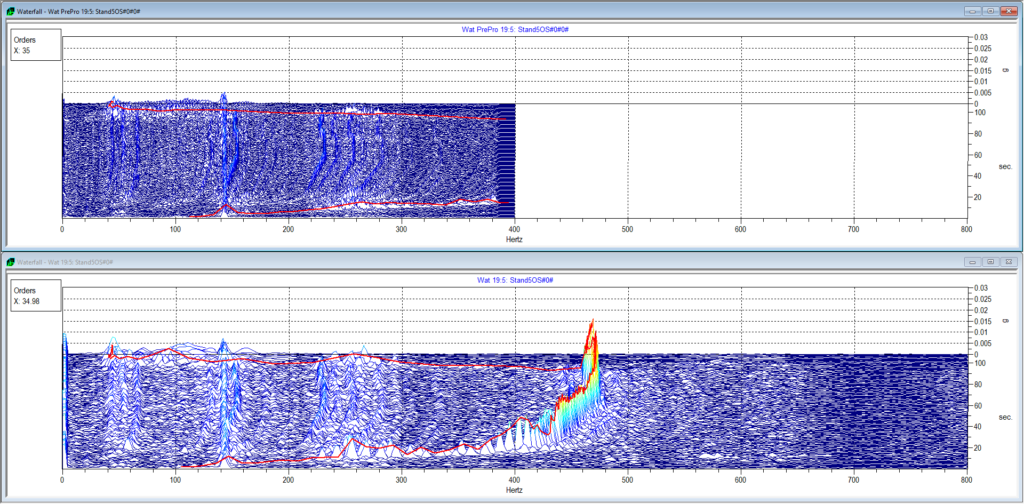
Figure 3: Sampling faster increases the Fmax and allows gear mesh to be detected (bottom spectrum)
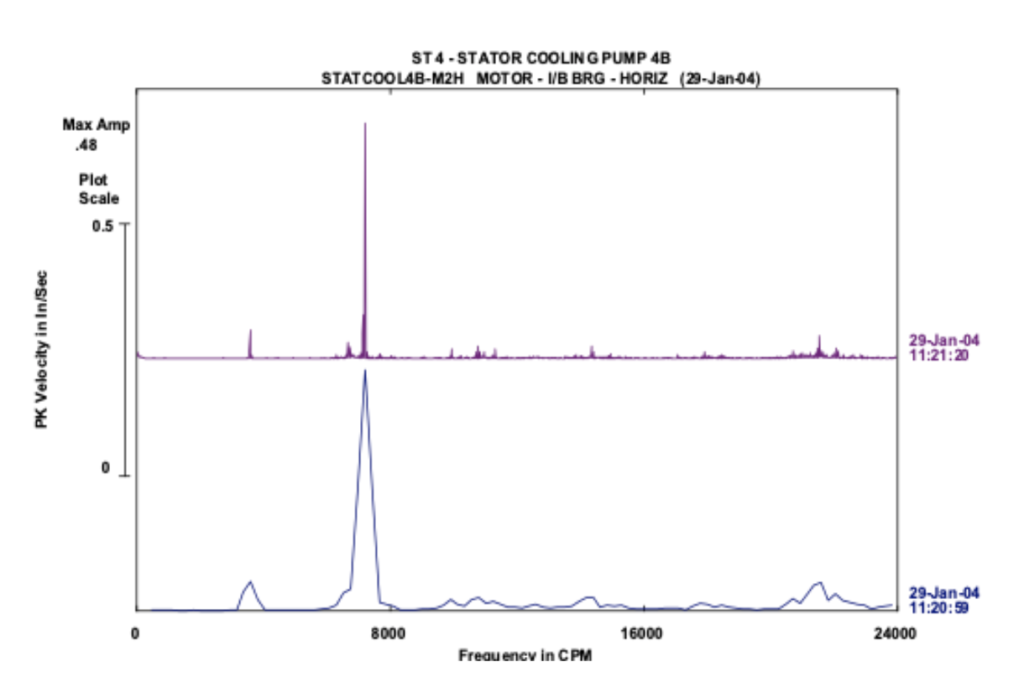
Figure 4: Increasing the LOR allows more valuable details to be visible in the data
Using the wrong sensor
A common mistake many analysts make is grabbing the wrong sensor (i.e. the wrong sensitivity for what they are trying to measure). Or, they are going from collecting data with a mobile device and a 100 mV/g sensor to a permanent mount on a junction box and collecting at a 50 mV/g accelerometer, thereby cutting amplitude in half and skewing trending and values.
Sensitivity is one of the most important parameters for accelerometers. It describes the conversion between vibration and voltage at a reference frequency and is specified in mV per g. Analysts need to make sure that they are using a sensor with the correct sensitivity for whatever it is they are measuring.
As they say, “the devil is in the details.” Good vibration data can be a treasure trove of valuable insights into the condition of machine assets as long as you can guarantee the quality of the data collected.
Need vibration data taken? Contact us – vibration analysis is our core competency.
