In today’s ultra-competitive marketplace, the financial pressure is intense to maintain manufacturing equipment. Plants are expected to maintain more equipment and deliver throughput at a lower cost and with fewer personnel. As a result, companies need to be continually searching for ways to improve their efficiency and bottom line. One method to accomplish these business goals is benchmarking equipment maintenance against competitors and industry averages.
“Measurement is the heart of any improvement process.” – Edward Deming, Quality Expert
Benchmarking equipment maintenance metrics as a tool
Benchmarking allows you to compare your practices against your own internal targets and industry best practices. It can also provide crucial focus and direction for a company’s efforts to improve.
So what are the most important metrics to benchmark against? Replacement asset value (RAV) can be a crucial key metric. Calculate the average cost of maintaining the plant measured against the value of the plant. RAV is a percentage of what it would cost to rebuild your plant, exactly as it is today. In addition, RAV indicates how well your team manages the expenditure on capital equipment. This approach takes into account the effect of inflation on project costs, inventory and maintenance costs.
For example, at 20 percent of RAV, you are spending so much on maintenance every year that you could buy a completely new plant for your operations every five years. In contrast, at two percent RAV, your company could be in business for 50 years before your maintenance costs rise to the level that building a new plant makes more sense.
Simply put, the lower the RAV, the more effective your maintenance efforts.

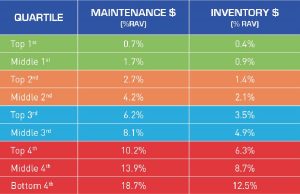
Figure 1: Power Generation Industry Averages for RAV*
The table in Figure 1 compares expenditures on maintenance and inventory between different quartiles. The best performers appear in the Top 1st Quartile, spending only .7% on maintenance against their replacement asset value (RAV) and a mere .4% on their inventory. For these companies, their teams connect the dots between maintenance and delivering value better than lower performing companies.
Want to see other industries? Download a PDF with 8 industries, including Automotive, Petrochemical, Chemical and Steel industries.
Where Do You Rank?
So how do companies drive their percentage of RAV numbers lower? The maintenance program you choose – reactive, preventive, predictive – can make all the difference. For more, check out the solutions IVC Technologies can offer your company.
Which maintenance program is most cost effective?
Stay tuned…
Coming next week: The 411 on the types of maintenance programs and which can be most effective for your business.
*All RAV industry table information provided courtesy of Management Resources Group, Inc., an Emerson company. © Emerson. All Rights Reserved.
